rdInst Tutorial 15 – Using the Stats Profiling Tool with Blueprints
Last Updated: 27th January 2023
Tutorial created using rdInst version 1.20
Version 1.10 introduces a new function in rdActor that gives you the ability to profile your Blueprint Functions and display the results with the Epic Stats viewer in-game.
Firstly, the profile name space for rdInst is, funnily enough “rdInst” – so at the console at any time you can type “stat rdInst” and the details will be shown.
C++ Profiling
If you’re wanting to profile your C++ routines, that’s a simple as adding the line below to your header file (replacing myFunction):
DECLARE_CYCLE_STAT(TEXT("myFunction"),STAT_myFunction,STATGROUP_rdInst);
and then in your C++ file, add the line below:
SCOPE_CYCLE_COUNTER(STAT_myFunction);
Add that at the beginning to profile the whole function, or to profile just a section, wrap it in squirley brackets {}.
Blueprint Profiling
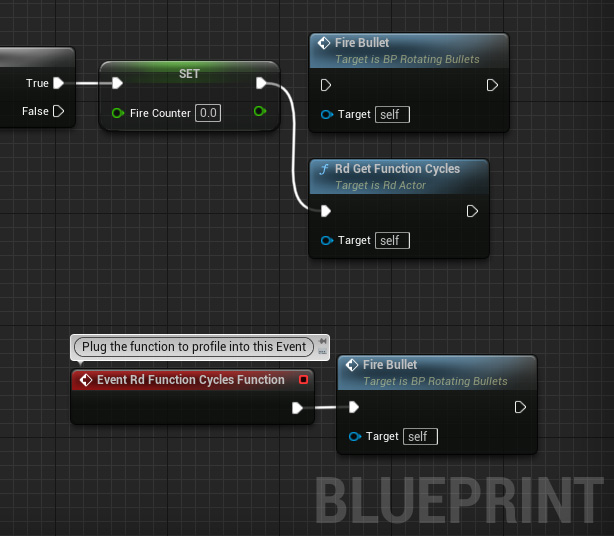
To Profile a Blueprint Function it’s slightly different. Where you’re wanting to normally call your Blueprint Function (from within an rdActor based Blueprint, the Event gets fired there), swap the call with a “rdGetFunctionCycles” node. Then in your EventGraph, add a “rdFunctionCyclesFunction” Event, and wire it up to the Function you’re wanting to profile.
